Student work
Solar System Infographic
Kade Estelle
ARTS 481 (Special Studio Projects) #senior | 2020 | New York, USA
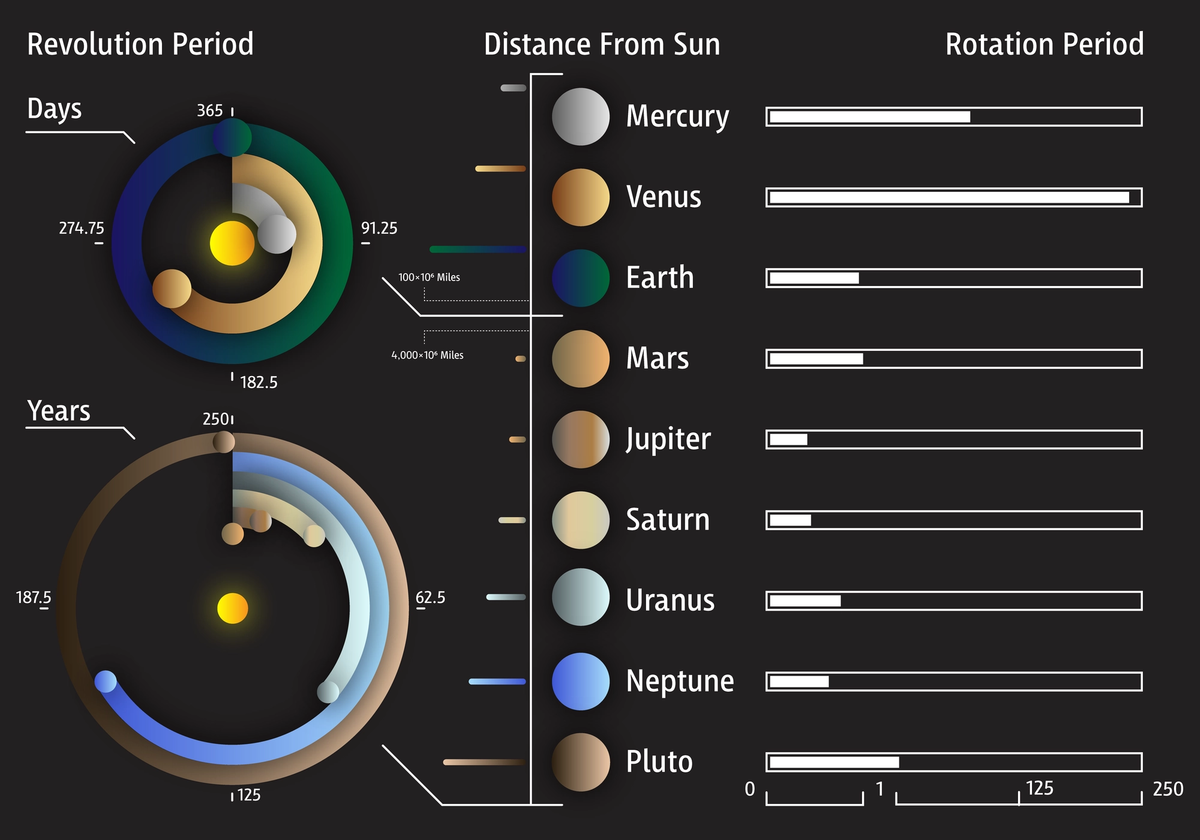
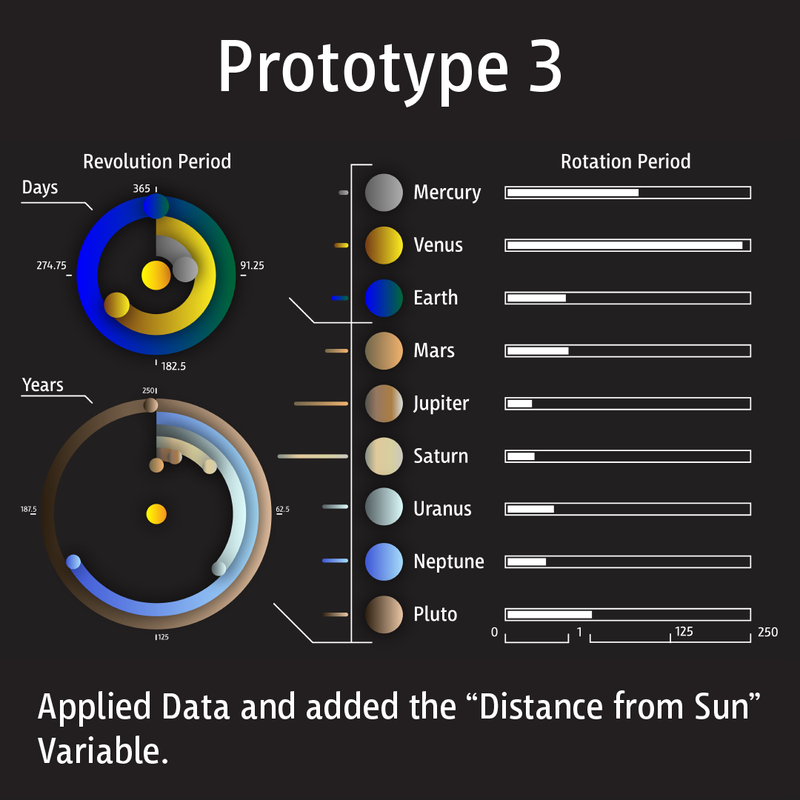
The task challenges students to plan and interpret the planet rotation numbers, and design an infographic for them. The graphic translation has to give visual evidence to the narrative. Students must gather, organize and use spatial, chronological, and quantitative data. The medium for presentation is part of the concept, either static, dynamic, or interactive. The project illustrates the following “Planetary Fact Sheet.” It’s fascinating to think of using space (design) to understand space (cosmos).
Here is the table of #s in Markdown syntax.
| Planet | Rotation Period | Revolution Period | Distance (Sun, 10⁶ miles)
|---|---|---|---|
| Mercury | 58.6 days | 87.97 days | 36.0
| Venus | 243 days | 224.7 days | 67.2
| Earth | 0.99 days | 365.26 days | 93.0
| Mars | 1.03 days | 1.88 years | 141.6
| Jupiter | 0.41 days | 11.86 years | 483.8
| Saturn | 0.45 days | 29.46 years | 890.8
| Uranus | 0.72 days | 84.01 years | 1784.8
| Neptune | 0.67 days | 164.79 years | 2793.1
| Pluto | 6.39 days | 248.59 years | 3670.0
You can choose to organize information according to different variables, each way will permit a different understanding of the information. So the choice will be determined by the story you want to tell.
—Richard Saul Wurman
The relationship between information and knowledge is a process that changes somebody’s knowledge (data → information → knowledge → understanding).
—Horst Rittel
Categories such as time, space, cause, and number represent the most general relations which exist between things; surpassing all our other ideas in extension, they dominate all the details of our intellectual life. If humankind did not agree upon these essential ideas at every moment, if they did not have the same conception of time, space, cause, and number, all contact between their minds would be impossible…
—Emile Durkheim
Clutter is a failure of design, not an attribute of information. Why can’t the information be the interface?
—Edward Tufte
